Major League Baseball 2011: Year of the Pitcher, Part 2 Comments Off on Major League Baseball 2011: Year of the Pitcher, Part 2
The Major League Baseball season is barely a month old and it is already clear that the pitching dominance that was evident a year ago is going to stick around for a while. In fact, if 2010 was known as the “Year of the Pitcher”, 2011 looks to be “Year of the Pitcher – Part 2” and unlike most movie sequels where the second attempt usually falls short of the original, this sequel might be even greater than the first one.
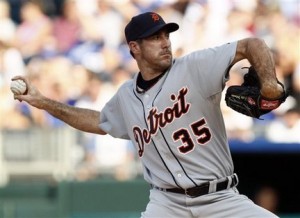
The no-hitters thrown during the last week by Francisco Liriano and Justin Verlander offer just a taste of what could be an unlimited amount of pitching excellence.
When analyzing the numbers, it really is amazing how drastic offensive performance has declined across major league baseball over the last five years and is now more in line with what was seen 20 years ago and in some cases as far back as the pre-designated hitter era.
That leads to the question of whether what is being experienced is really a case of the quality of pitching rising to greater heights or merely a re-balancing of the game to where it would have always been had it not been for the performance enhancing drug era.
But whatever the reason, there is no denying that the statistics for pitchers are improving and those for hitters are declining.
Consider that so far in 2011 the average number of runs scored per team per game is 4.19 and the league-wide batting average is .249. The last time the league-wide average for runs per game was comparable was in 1992 when the average was 4.12 and the league-wide batting average was .256. The league-wide Earned Run Average (ERA) was 3.75.
Just two years later, in what is considered to be the start of the steroid era in 1994, the league-wide average jumped to 4.92 runs per team per game and the league-wide batting average was .270. The ERA for the league also jumped to 4.51.
Just as recently as 2006, teams were averaging 4.86 runs per game with a .269 average while the league-wide ERA was 4.53.
After a league-wide ERA of 4.08 a year ago, the best in the league for a season since 1992, hurlers across baseball are on pace this season for an ERA of 3.82.
If the current league-wide batting average of .249 continues for the entire season, it will be the first time since 1972 when the league had an average below .250. During that season, the league hit .244 while teams averaged 3.69 runs per game and .65 home runs per game. Read the rest of this entry →
