Major League Baseball 2011: Year of the Pitcher, Part 2
The Major League Baseball season is barely a month old and it is already clear that the pitching dominance that was evident a year ago is going to stick around for a while. In fact, if 2010 was known as the “Year of the Pitcher”, 2011 looks to be “Year of the Pitcher – Part 2” and unlike most movie sequels where the second attempt usually falls short of the original, this sequel might be even greater than the first one.
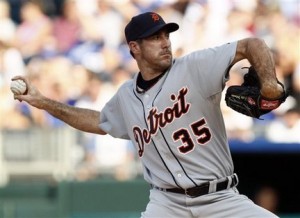
The no-hitters thrown during the last week by Francisco Liriano and Justin Verlander offer just a taste of what could be an unlimited amount of pitching excellence.
When analyzing the numbers, it really is amazing how drastic offensive performance has declined across major league baseball over the last five years and is now more in line with what was seen 20 years ago and in some cases as far back as the pre-designated hitter era.
That leads to the question of whether what is being experienced is really a case of the quality of pitching rising to greater heights or merely a re-balancing of the game to where it would have always been had it not been for the performance enhancing drug era.
But whatever the reason, there is no denying that the statistics for pitchers are improving and those for hitters are declining.
Consider that so far in 2011 the average number of runs scored per team per game is 4.19 and the league-wide batting average is .249. The last time the league-wide average for runs per game was comparable was in 1992 when the average was 4.12 and the league-wide batting average was .256. The league-wide Earned Run Average (ERA) was 3.75.
Just two years later, in what is considered to be the start of the steroid era in 1994, the league-wide average jumped to 4.92 runs per team per game and the league-wide batting average was .270. The ERA for the league also jumped to 4.51.
Just as recently as 2006, teams were averaging 4.86 runs per game with a .269 average while the league-wide ERA was 4.53.
After a league-wide ERA of 4.08 a year ago, the best in the league for a season since 1992, hurlers across baseball are on pace this season for an ERA of 3.82.
If the current league-wide batting average of .249 continues for the entire season, it will be the first time since 1972 when the league had an average below .250. During that season, the league hit .244 while teams averaged 3.69 runs per game and .65 home runs per game.
What is the Biggest Reason for the Reduction in Baseball Run Production?
- End of the Steroid Era (59%, 30 Votes)
- No One Factor (20%, 10 Votes)
- Influx of Great Young Pitchers (14%, 7 Votes)
- Lack of Baseball Fundamentals (6%, 3 Votes)
- Changes in the Strike Zone (2%, 1 Votes)
Total Voters: 53
It is easy to target steroids for the decline in home runs per team per game from 1.17 in 2000 to 1.11 in 2006, .95 a year ago and .88 so far this season, but the decline in the league-wide batting average is particularly amazing and a little more difficult to understand.
Especially when those who have admitted to using steroids like Mark McGwire have claimed that they really don’t help you hit a baseball better.
Yeah, okay, if you want to believe that I have some great beach front property in the Sierra I’d love to sell you.
But the question is how much the pitching has to do with the decline in hitting.
In 1972, which was also the last year before the designated hitter was introduced in the American League, the league-leader in ERA in both leagues had an ERA under 2.0 (Steve Carlton at 1.97 in the NL and Luis Tiant at 1.91 in the AL). The top 10 in ERA in the American League all had an ERA of 2.50 or under and in the National League the 10th highest ERA was 2.77.
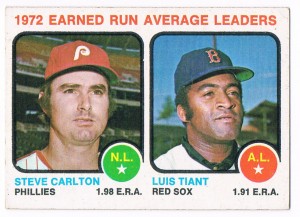
The last time the league batting average was as low as it is currently, the ERA champs in both leagues had ERA's under two runs per game.
At the peak of the power era in 2000, Pedro Martinez had an amazing 1.74 ERA to lead the major leagues, but Roger Clemens and Mike Mussina finished second and third in the AL with ERAs of 3.70 and 3.79 respectively. In the National League there were three pitchers with ERAs under 3.0, led by Kevin Brown at 2.58.
Last season, Felix Hernandez led the majors with an ERA of 2.27 and Josh Johnson led the NL with a 2.30 ERA. The top 10 pitchers in the NL all had ERAs under 3.0 while four pitchers in the AL were under 3.0.
Though the sample size so far in 2011 isn’t extensive, it appears that the number of pitchers with low ERAs is going to be at the highest level since the early 1990s and perhaps in the ballpark of the pre-designated hitter era.
There are currently three pitchers in the AL and two in the NL with ERAs under two runs per game. The top 10 in ERA in the AL all have averages of 2.58 and lower and in the NL the 10th best ERA is 2.63.
Some are quick to say that a re-emphasis on pitching talent is a big factor, but I’m not sure that I can truly buy that argument.
Nothing against the quality pitchers currently in the league, but to suggest that the reason for the decline in hitting numbers is significantly a result of the current pitchers being better than those of the 1990s and 2000s is a very flimsy argument.
Pitchers like Felix Hernandez, Tim Lincecum, Roy Halladay, C C Sabathia and David Price are definitely standouts, but certainly no better than the best pitchers of the previous era such as Greg Maddux, Pedro Rodriguez, Curt Schilling, Tom Glavine, John Smoltz and Randy Johnson.
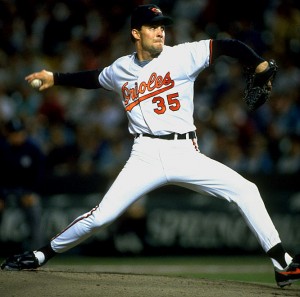
One pitcher that I think illustrates just how challenging it was for pitchers between 1994 and 2006 was former Orioles and Yankees hurler Mike Mussina.
During his rookie campaign in 1992, Mussina went 18-5 with a career-best 2.54 ERA. Two years later he was 16-5 with a 3.06 ERA when the strike cancelled the remainder of the 1994 campaign.
Between 1995 and 2006 Mussina went 187-113, yet his best single season ERA was 3.15 and he had an ERA of 3.50 or higher seven times. In 2008 as the overall run production across the majors started to return to normal, Mussina posted a 20-9 record with a 3.37 ERA at the age of 39.
Perhaps another reason for the sharp decline in overall offensive production in recent years is that the steroid era and inflated home run totals changed the focus of the game away from getting base hits and toward the long ball. So you have a generation of players that still go to the plate thinking they can hit every pitch out of the park, instead of thinking about getting a base hit. Certainly the smaller ballparks that have been built in the last 15 years attribute to that philosophy.
But in recent years you have seen a lot more “warning track power” than you did five or ten years ago.
For that reason, there are some teams that are going back to the basics of manufacturing runs, but some of the nuances of the game such as the hit-and-run and situational hitting are ancient fossils that are no longer second nature to every player in the league.
It will take time to get both players and coaches re-taught on some of the ways to score runs other than wait for the next home run and until that happens there may not be a significant increase in runs unless some other unexpected factor comes into play.
Of course, considering that MLB has a track record of massaging the rules or turning the other way to ensure that offense is a prominent part of baseball, you can bet that they will figure something out to increase offensive production.
I have no problem with evening things back up again just as long as it doesn’t lead to Steroid Era Part 2.
