Forget Baseball, The NBA Is The Least Competitive Professional League
The uneven distribution of talent is structural. Can you spell LOTTERY?
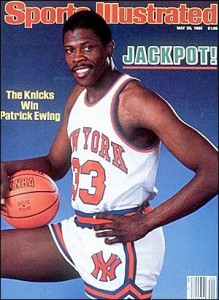
The NBA lottery has not dispersed success the way people originally expected.
You can blame Patrick Ewing for the mess in the NBA.
Is there a mess? Don’t you “love this game?” Aren’t the games better attended, the media exposure better than ever, the league’s popularity and fan base broader than ever? Perhaps, but it won’t last. One of these days fans in 24 cities will wake up and realize the fix is in. It is always in.
Now it is true that “Amazing things happen” in the NBA, but not necessarily in the sense that their current tagline implies. What is amazing, is that the league has gotten away with fixing outcomes, if not fixing individual games, and the victims—most of the league’s fans—are none the wiser. But people are starting to figure it out.
In the 24 years since 1985 when the NBA adopted a lottery to determine draft order, there have been six league champions. The league has expanded to 30 cities in that time but there have been only six champs. Five of them have been from the league’s largest markets.
Since the inception of the lottery, the Lakers have won six titles, Chicago six, Detroit three, Boston two, Houston two, Miami one. That’s 20 titles out of 24 total, to teams from the league’s 11* largest markets. That leaves little San Antonio (37th* largest in US, 27th of 30 in NBA), with four.
By contrast, in the nineteen years between the Celtics eight straight titles (1959-1966) and the implementation of the lottery (1985), there were nine different champions. One third of those were small market teams: Milwaukee, Portland, and Seattle.
(It is true that the Celtics and the Lakers– including six titles in Minneapolis– dominated the league in its early years, but the draft was not fully operational until the sixties, and it could be said that the institution of the draft brought down the Celtics dynasty.)
So, you do the math: nine different champions in 19 years versus six champs in 24 years; three small market teams out of nine versus one out of six. And you can blame Patrick Ewing, even though his Knicks never won a title.
Well, actually it wasn’t Patrick’s fault. Perhaps the blame lies with NBA Commissioner David Stern. But Patrick was the catalyst.
After making three appearances in the national championship game and winning a national title in 1984 during four dominating seasons at Georgetown, Ewing was hands down going to be the consensus #1 pick in the 1985 NBA Draft– in a league of his own.
Up until then, the tradition had been that the teams with the two worst records would flip a coin for the first pick. Conspiracy theorists would claim that there is an obvious reason the NBA, under Stern’s insistence, decided to abandon that time-tested tradition and implement a lottery to determine the order in which the seven worst teams would select eligible college players and a reason why they chose that particular year to do it.
The New York Knicks happened to have the third worst record going into the 1985 draft, at 26-56. Curiously, and not coincidentally, critics would say, by scrapping the old system and instituting a lottery, the league’s largest media market would get a shot at scoring the top pick.
Also, curiously and perhaps not coincidentally, in this particular year, with Ewing, the first pick was especially valuable.
More curiously, the Knicks won the lottery.

The San Antonio Spurs are the only small market team to win the NBA title since the start of the draft lottery in 1985.
Under the old system, the Golden State Warriors and Indiana Pacers, both of which tied for the worst record in the league with 22-60 campaigns in 1984-1985, would have flipped a coin for the #1 selection and the rights to Ewing. Can you imagine how different the outcomes in the league might have been if Ewing had landed in the Bay Area, or even more so, in Indiana.
And that is the point. Some suspect David Stern just couldn’t live with either eventuality. Especially Indianapolis, which at that point in time was ranked below its current media market rank* of 25th and was no doubt even lower on the scale of “coolness.” He did the TV revenue calculations, factored in the licensed apparel sales calculations (not good for a star on a team in a “hick” Midwest town) and couldn’t sleep at night. He had to do something. And, some suspect, that’s just what he did.
Those conspiracy theorists alleged that New York’s envelope was thrown into the lottery basket so as to clip a corner on the side of the basket, causing a little fold in the corner of the envelope, allowing it to stand out from the other six. The allegation followed, then, that, Stern, determined to have Ewing in New York, managed to “mark” the New York envelope, pulled the envelope with the folded corner out of the basket, and—surprise—it was New York’s. And surprise—they selected Ewing.
Whether or not there was actual foul play in the selection of the New York envelope, it is hard not to assume that the league’s sole reason for adopting the lottery was in the hope that New York would end up with Ewing, and more to the point, that in future years, the system would be skewed to favor larger markets.
How does that compare with other major leagues?
We know the NHL has extremely competitive teams in its smaller markets, such as Buffalo, Ottawa, and Calgary.
Major League Baseball, despite its disparity in franchise wealth relative to market size, especially in New York, has seen a surprising number of worst to first transformations, a surprising variety of champions over the past several years, and a surprising level of competitiveness among at least some of the smaller market teams.
The NFL, a paragon of parity, has proven over the past 40 years (since the merger) that even when there are 22 first string players, a high draft pick can turn around a franchise. The NFL understands that parity is essential to the brand. It is not curious or coincidental that teams routinely go from worst to first in the NFL, or that its smallest markets such as Green Bay, Buffalo, Jacksonville, Nashville, Indianapolis, Pittsburgh, Arizona, St. Louis, San Diego, Charlotte, and of course New Orleans have often had top echelon teams. In fact each of these teams (except Jacksonville) have appeared in at least one Super Bowl, and the three smallest market teams, New Orleans, Buffalo and Green Bay have combined for a total of 10 appearances out of 44 games. A large majority of Super Bowl winners have come from markets ranked* 20th or lower, and a slightly smaller majority from those ranked* 25th and below (out of 32 teams).
In the NBA, where there are only five players on the court at one time, a top pick, especially when there is a player of Ewing’s ability (or Jordan’s or, or, or..) available, can turn a franchise around singlehandedly in a year or two. Given that, it is even more critical when instead of competing with the second worst team for the first draft choice, the league’s worst team could end up getting the seventh best player in the draft. The ramifications of this, especially when factored over a decade or more, are obvious. The actual results of league competition since the change simply bear out the logical assumptions one might make. The NBA puts the interests of big-market teams ahead of concern for competitive balance.
Given the increased popularity and revenue the NBA has enjoyed in the lottery era compared to its pre-lottery history, one might assume that they made the right decision. But I predict it won’t be much longer before the have-nots realize the fix is in, and they’re out.
And it isn’t limited to determining draft order. The speculation over where the league’s current god, LeBron James, will end up when his contract with Cleveland expires, gives further credence to the big-market bias in the league. We hear very little about the possibility that James may opt to remain in his hometown, rather than throwing himself to the highest big-market bidder. The speculation is primarily focused on LA and New York. While Cleveland managed by sheer extraordinary luck to thwart the league’s best efforts to get him in a major market, the NBA and its bi-coastal duopoly have been licking their lips ever since awaiting the expiration date on his contract to get him in one place or the other.
If you read the buzz coming out of New York, especially, there is the assumption that James is rightfully theirs and that he will be a Knick next year. I certainly hope he isn’t, for a variety of reasons, but the point is that not only does the NBA use its lottery to limit the smaller markets’ access to top talent, their approach to free agency further favors the largest markets.
What David Stern and the NBA apparently do not understand is that there has to be the proverbial “reason why we play the game.” The truism of what can happen on “any given day” has to be true or eventually the league will fail. The best thing any sports league can do for its largest markets is to keep the small market teams competitive. And that doesn’t just mean making the playoffs. That means advancing. That means winning it all, a fair share of the time.
Whenever there is less than a fair fight, those who are on the short end of the stick eventually figure it out, take their ball, and go home. Even the fans of the perennial winners will become bored if there isn’t sufficient suspense as to their team’s fortunes.
Mr. James and his hometown Cavaliers need to win the NBA title this year for any number of reasons, but as much for the good of LA and Boston and New York as for Cleveland and every other second rate city that hitches their wagon vicariously to LeBron’s star. And if not Cleveland, then anyone but one of the top 11 markets.
That leaves several teams with at least a fighting chance, not the least of which, the league’s new smallest market and their new up and coming franchise: Oklahoma City. Now if that were to happen, that would be some Oklahoma thunder storm. Otherwise, the league may just eventually succumb to drought.
| *Top 50 TV Markets Ranked by Households, 2004 | ||||||
|
Rank |
Designated Market Area (DMA) |
TV Households |
% of US |
|||
|
1 |
New York |
7,375,530 |
6.692 |
|||
|
2 |
Los Angeles |
5,536,430 |
5.023 |
|||
|
3 |
Chicago |
3,430,790 |
3.113 |
|||
|
4 |
Philadelphia |
2,925,560 |
2.654 |
|||
|
5 |
Boston (Manchester) |
2,375,310 |
2.155 |
|||
|
6 |
San Francisco-Oak-San Jose |
2,355,740 |
2.137 |
|||
|
7 |
Dallas-Ft. Worth |
2,336,140 |
2.120 |
|||
|
8 |
Washington, DC (Hagrstwn) |
2,252,550 |
2.044 |
|||
|
9 |
Atlanta |
2,097,220 |
1.903 |
|||
|
10 |
Houston |
1,938,670 |
1.759 |
|||
|
11 |
Detroit |
1,936,350 |
1.757 |
|||
|
12 |
Tampa-St. Pete (Sarasota) |
1,710,400 |
1.552 |
|||
|
13 |
Seattle-Tacoma |
1,701,950 |
1.544 |
|||
|
14 |
Phoenix (Prescott) |
1,660,430 |
1.507 |
|||
|
15 |
Minneapolis-St. Paul |
1,652,940 |
1.500 |
|||
|
16 |
Cleveland-Akron |
1,541,780 |
1.399 |
|||
|
17 |
Miami-Ft. Lauderdale |
1,522,960 |
1.382 |
|||
|
18 |
Denver |
1,415,180 |
1.284 |
|||
|
19 |
Sacramento-Stktn-Modesto |
1,345,820 |
1.221 |
|||
|
20 |
Orlando-Daytona Bch-Melbrn |
1,345,700 |
1.221 |
|||
|
21 |
St. Louis |
1,222,380 |
1.109 |
|||
|
22 |
Pittsburgh |
1,169,800 |
1.061 |
|||
|
23 |
Portland, OR |
1,099,890 |
0.998 |
|||
|
24 |
Baltimore |
1,089,220 |
0.988 |
|||
|
25 |
Indianapolis |
1,053,750 |
0.956 |
|||
|
26 |
San Diego |
1,026,160 |
0.931 |
|||
|
27 |
Charlotte |
1,020,130 |
0.926 |
|||
|
28 |
Hartford & New Haven |
1,013,350 |
0.919 |
|||
|
29 |
Raleigh-Durham (Fayetvlle) |
985,200 |
0.894 |
|||
|
30 |
Nashville |
927,500 |
0.842 |
|||
|
31 |
Kansas City |
903,540 |
0.820 |
|||
|
32 |
Columbus, OH |
890,770 |
0.808 |
|||
|
33 |
Milwaukee |
880,390 |
0.799 |
|||
|
34 |
Cincinnati |
880,190 |
0.799 |
|||
|
35 |
Greenvll-Spart-Ashevll-And |
815,460 |
0.740 |
|||
|
36 |
Salt Lake City |
810,830 |
0.736 |
|||
|
37 |
San Antonio |
760,410 |
0.690 |
|||
|
38 |
West Palm Beach-Ft. Pierce |
751,930 |
0.682 |
|||
|
39 |
Grand Rapids-Kalmzoo-B.Crk |
731,630 |
0.664 |
|||
|
40 |
Birmingham (Ann and Tusc) |
716,520 |
0.650 |
|||
|
41 |
Harrisburg-Lncstr-Leb-York |
707,010 |
0.641 |
|||
|
42 |
Norfolk-Portsmth-Newpt Nws |
704,810 |
0.640 |
|||
|
43 |
New Orleans |
672,150 |
0.610 |
|||
|
44 |
Memphis |
657670 |
0.597 |
|||
|
45 |
Oklahoma City |
655,400 |
0.595 |
|||
|
46 |
Albuquerque-Santa Fe |
653,680 |
0.593 |
|||
|
47 |
Greensboro-H.Point-W.Salem |
652,020 |
0.592 |
|||
|
48 |
Las Vegas |
651,110 |
0.591 |
|||
|
49 |
Buffalo |
644,430 |
0.585 |
|||
|
50 |
Louisville |
643,290 |
0.584 |
|||
Source : Nielsen Media Research, Inc. Nielsen Station Index (NSI)
